2016
Initial Thoughts on the Presidential Election of 2016

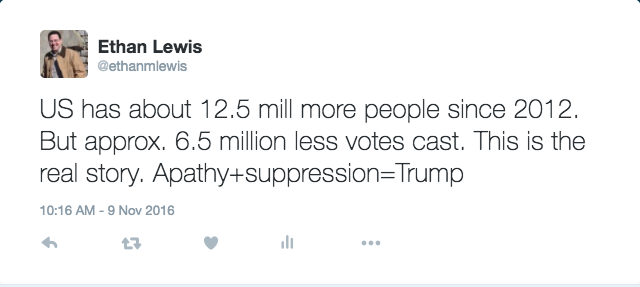
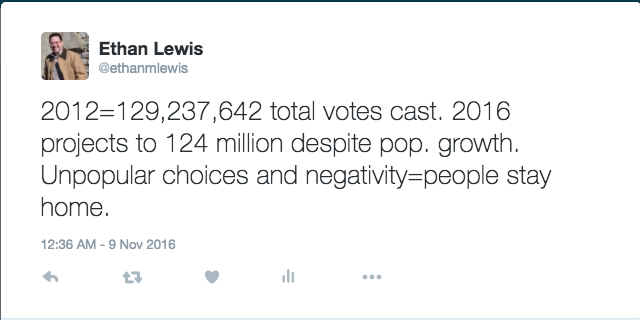 But as I stayed up until 3AM on election night waiting to see what would transpire, I realized that in a way I was on to something. Far fewer people voted this year than normally do, and while numbers have changed the picture somewhat from the tweet at left I stand by my thesis that “unpopular choices and negativity” resulted in the large number of non-voters in 2016.

To be sure, it’s not like America is a place where most people who have a chance to vote actually cast ballots. Our friends at Wikipedia have a nice page on voter turnout, and in the eleven Presidential elections in my lifetime, the average participation of eligible voters has been 53.4%. Every one of these elections came after the 26th Amendment expanded the franchise to include all Americans over the age of 18, and includes the pathetic election of 1996, when Bill Clinton was re-elected with 49% of the vote of the 49% of the voters who voted. The Pew Center shows us that Americans are not disposed to expressing their opinion at the voting booth, especially compared to other countries.
If we take a close look at the results of the last five Presidential elections, we can see that things are actually a little more complicated than we typically think. My favorite “go to” resource for results of American elections is the wonderful “Dave Leip’s US Election Atlas“. You can see detailed breakdown of the elections here:
- 2016 Election Results (as of 11/13/16)
- 2012 Election Results
- 2008 Election Results
- 2004 Election Results
- 2000 Election Results
 I have always used this information when refuting the myth that “Ralph Nader’s voters threw the election of 2000 to George W. Bush”. First of all, if Al Gore had only won his own state of Tennessee, the Supreme Court would never have gotten involved in the election. Secondly, while Nader received over 2.8 million votes that year (including mine), can you remember how many candidates received votes that year? Well let’s see there was Gore, and Bush, and Nader. Oh, and Buchanan of course. Four, right? Wrong! Over a dozen other individuals received more than 1 million total votes in 2000. Why don’t they get any blame? Probably due to the mindshare that America’s “two party” system holds, that makes most people unable to cognitively recognize other choices, even as protest votes.
And if that surprises you, it will doubtless be quite a shock to learn that at least 14 people in 2004, at least 21 people in 2008 and over 25 people in 2012 received Presidential votes. But now that you are over your surprise, you won’t even blink when you see that TWENTY-NINE people other than Trump and Clinton claimed at least 300 votes last week. For all of your friends who castigated you that a “protest” vote for Gary Johnson was wasted, you can point to the 702 people who voted for Rod and Richard Silva on the Nutrition Party ticket. He was ready to wage war on cholesterol, and now we’ll have to wait another four fatty years until that scourge can be addressed.
If you look closely at the data you’ll see that I was sort of right, in that fewer people seem to have voted this year than expected. The American population is constantly growing (in 2000 it was 282 million, this year it is over 323 million) and the number of eligible voters grows accordingly. As a result, the total number of votes cast has increased nearly every election of my life, with two exceptions. For the last five elections, the numbers are:
- 1992: 104,426,611
- 1996: 96,275,640
- 2000: 105,425,985
- 2004: 122,303,590
- 2008: 131,473,705
- 2012: 129,237,642
- 2016: 128,928,498* (votes are still being counted)
So the only times that the number of voters did NOT increase were in the aforementioned 1996 election when people were not excited about Bill Clinton and Bob Dole seemed like a sacrificial lamb nominated for a lifetime of service, rather than for any new ideas; 2012 when the excitement about Barack Obama had worn off and Mitt Romney was nominated for a lifetime of service, rather than new ideas (except for Romneycare, which he ran AWAY from); and 2016, when the two major parties nominated the least popular candidates ever and Hillary Clinton seemed to be nominated for a lifetime of service, rather than new ideas (except for the ones she adopted from Bernie Sanders). The lesson here to me is that if you want to get people excited about their choices, they need to have REAL choices, who present specific, unique ideas that resonate with the public.
One more dive into the data should suffice to prove this point. If you look at the raw vote data, you’ll see that Trump was elected with fewer votes than any winner since 2000 (whoever you count as the “winner”). Beyond that, you’ll see that compared to 2012, the number of votes was down all over the country, sometimes by large amounts. Perhaps California was such a foregone conclusion that we can excuse 30% fewer Democrats voting for Clinton than voted for Obama and 38% fewer Republicans voting for Trump than voted for Romney. But what about the so-called “battleground” states? Iowa flipped from Democratic to Republican, and 20.88% fewer Democrats voted for Clinton than did for Obama four years ago (GOP votes were up in Iowa by over 9%). The story repeated itself in other parts of Clinton’s “blue wall”: In Ohio Clinton got 18% fewer votes than Obama did (and Trump improved on Romney by 4%) and in Michigan, the Democratic candidate got 11.59% less votes than Obama and Trump garnered 7.75% more votes than Romney to turn the state red. Wisconsin and Pennsylvania saw similar numbers. In short, people who were “expected” to vote Democratic were not inspired to go to the trouble of voting for a candidate who didn’t excite them.
Views: 258